Introduction
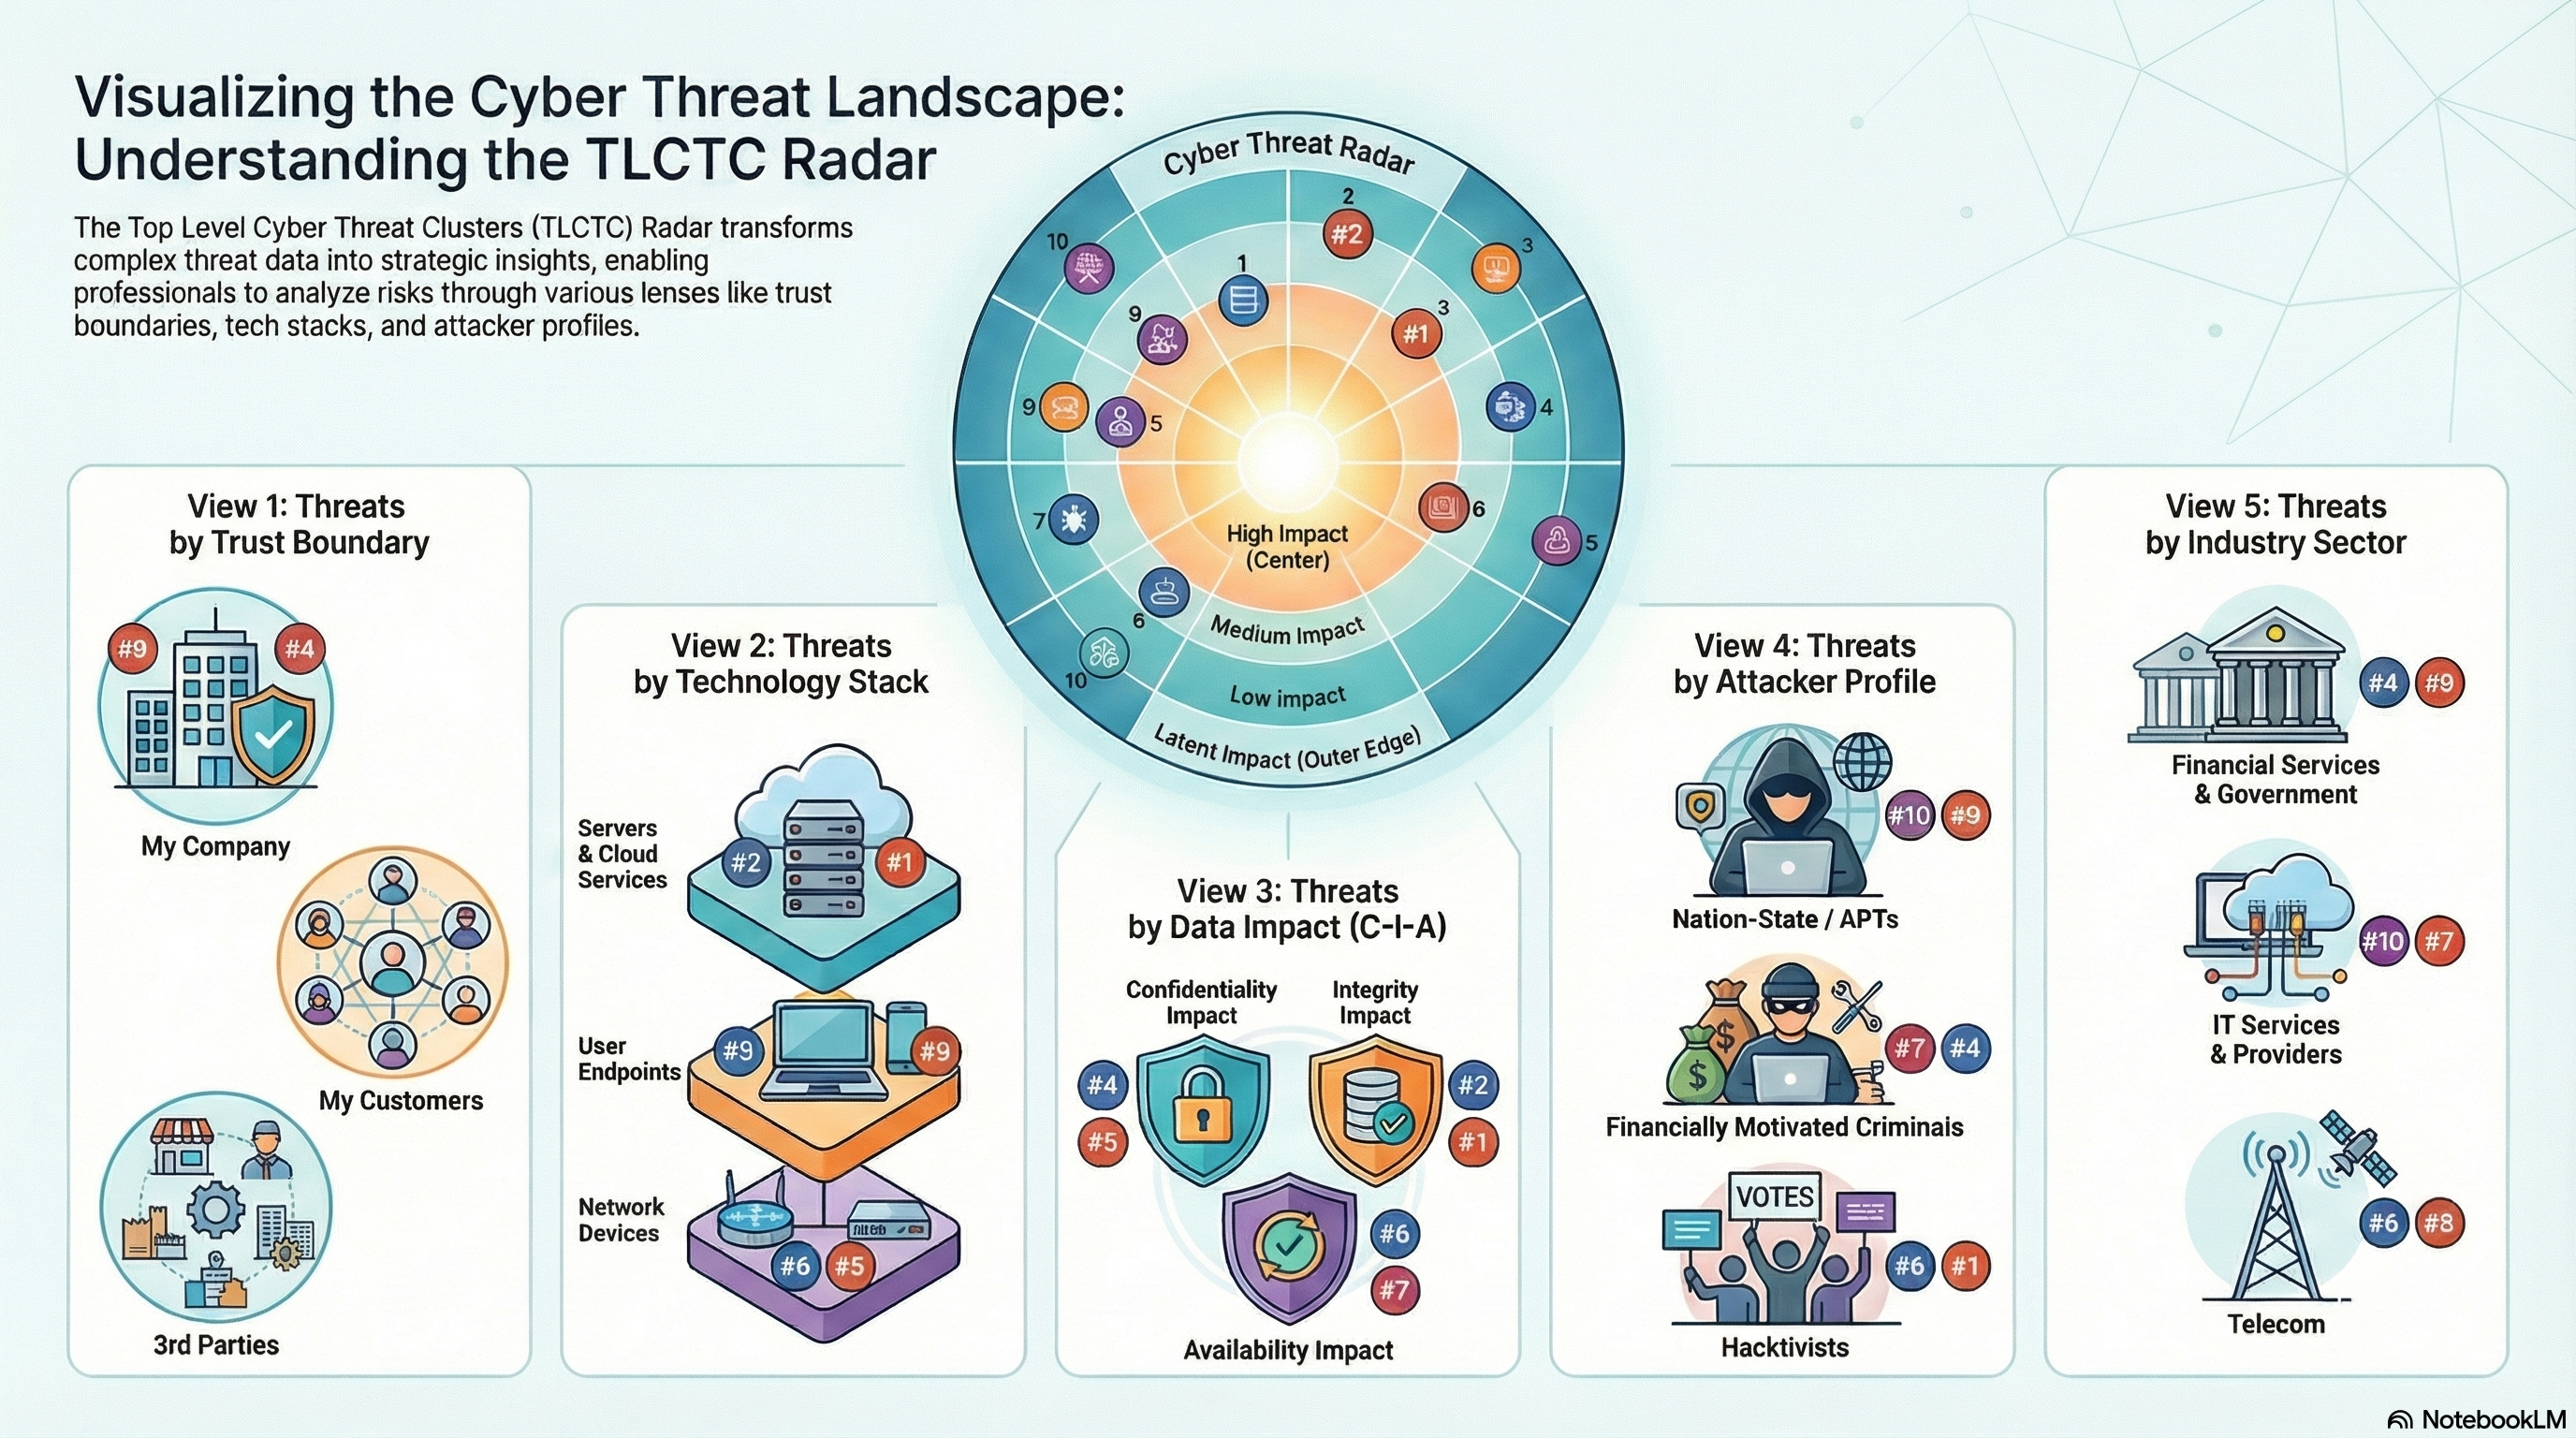
The Top Level Cyber Threat Clusters (TLCTC) framework simplifies the complexity of cyber risk by grouping all technical attack vectors into ten mutually exclusive "Clusters" based on the generic vulnerability they exploit. This article explores how the TLCTC Radar tool translates these concepts into actionable intelligence.
Five Practical Applications of TLCTC Radar
The radar concept is flexible. It allows security leaders to visualize the 10 Clusters through different lenses depending on the strategic question being asked.
1. Organizational Boundary Analysis
This view answers: "Where are the threats originating relative to our trust boundaries?"
This visualization highlights the distinction between threats targeting the organization directly versus those crossing via trust boundaries:
- Customer Channel: High activity in #4 Identity Theft and #9 Social Engineering. Attackers abuse human trust (#9) to gain credentials (#4) and impersonate legitimate users.
- 3rd Party: Significant risk in #10 Supply Chain. This marks the transition where a vendor's compromise becomes the organization's risk. Note that if malicious code executes, it is #7 Malware, but the entry vector via the trusted channel is #10.
2. Infrastructure Domain Analysis
This view answers: "Which parts of our tech stack are being targeted by which clusters?"
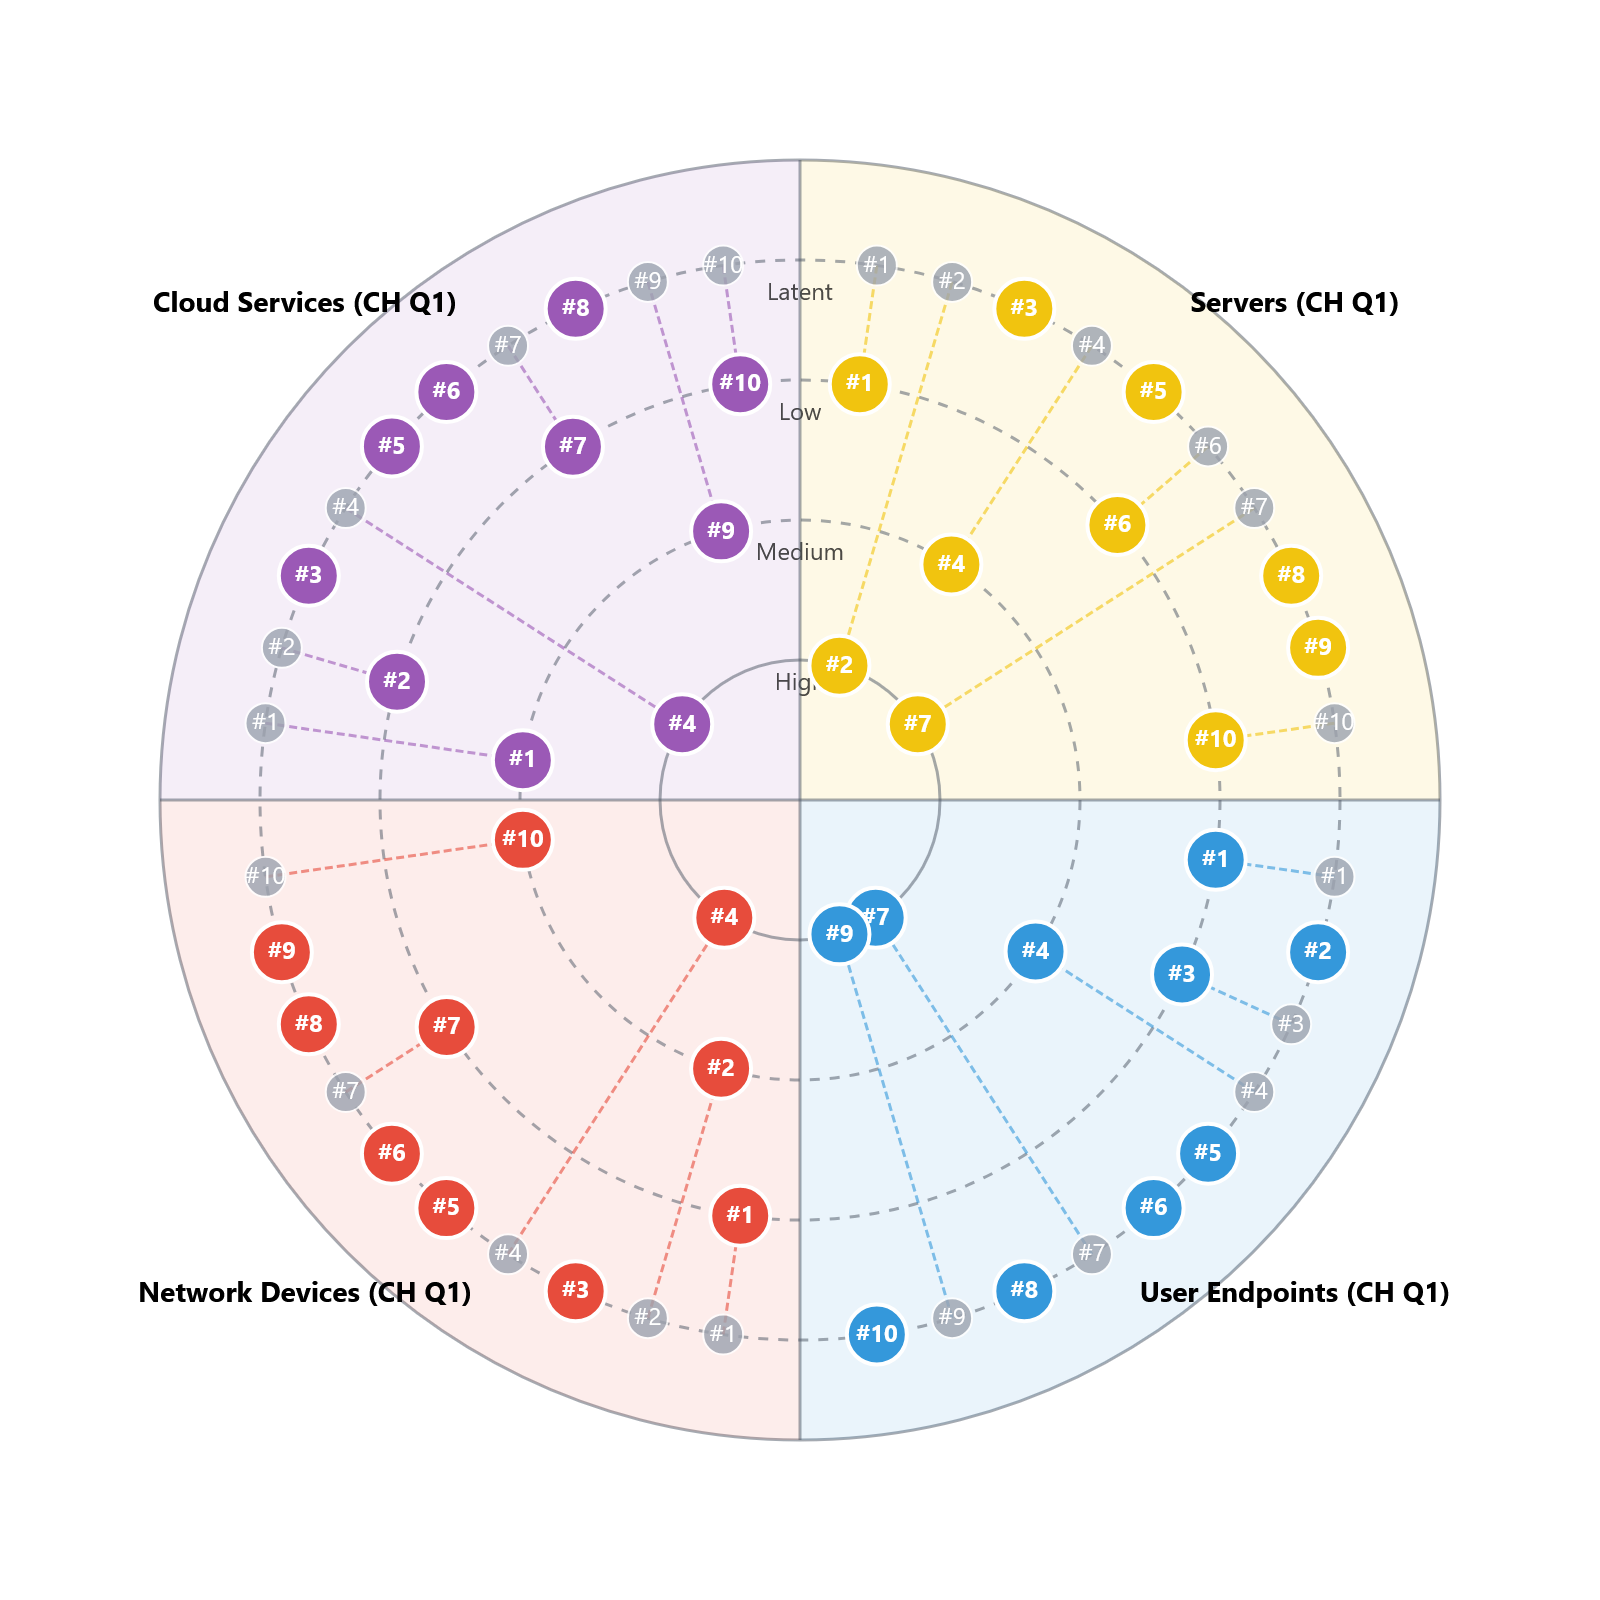
- Servers & Cloud: High intensity in #2 Exploiting Server (code implementation flaws) and #1 Abuse of Functions (misconfiguration/logic abuse).
- Endpoints: The primary battleground for #3 Exploiting Client (browsers/apps processing malicious data) and #9 Social Engineering.
- Network: The domain of #6 Flooding (capacity exhaustion) and #5 Man in the Middle (path interception).
3. Data Risk Impact Analysis (CIA)
This view connects Threat Causes (Clusters) to Risk Consequences (Data Risk Events).
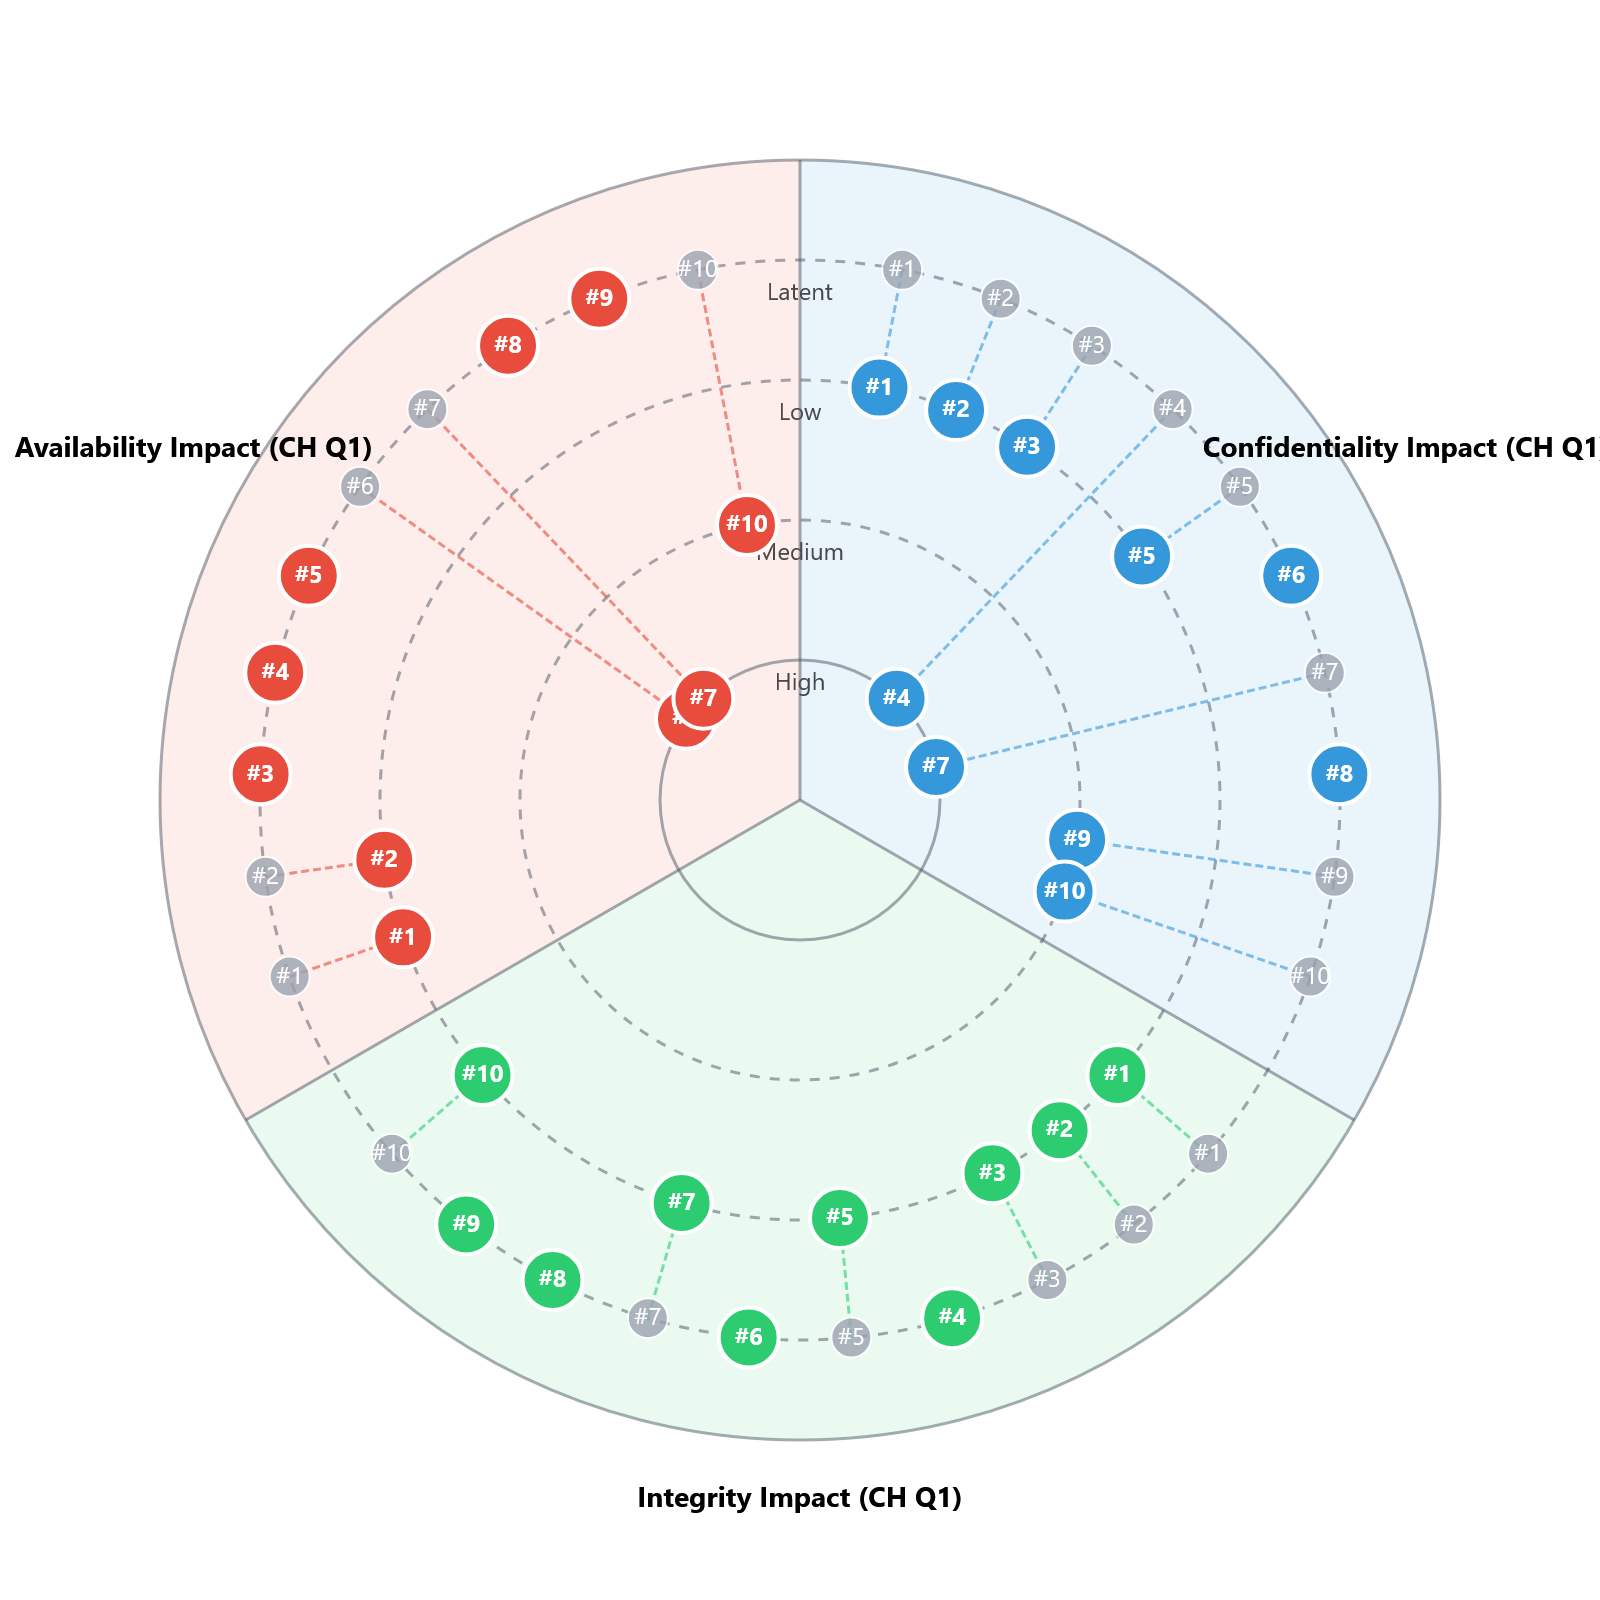
- Confidentiality: Primarily threatened by #4 Identity Theft (unauthorized access) and #5 MitM (interception).
- Availability: The domain of #6 Flooding and destructive #7 Malware (Ransomware).
- Integrity: Often compromised via #2 Exploiting Server (SQLi modifying data) or #1 Abuse of Functions (logic manipulation).
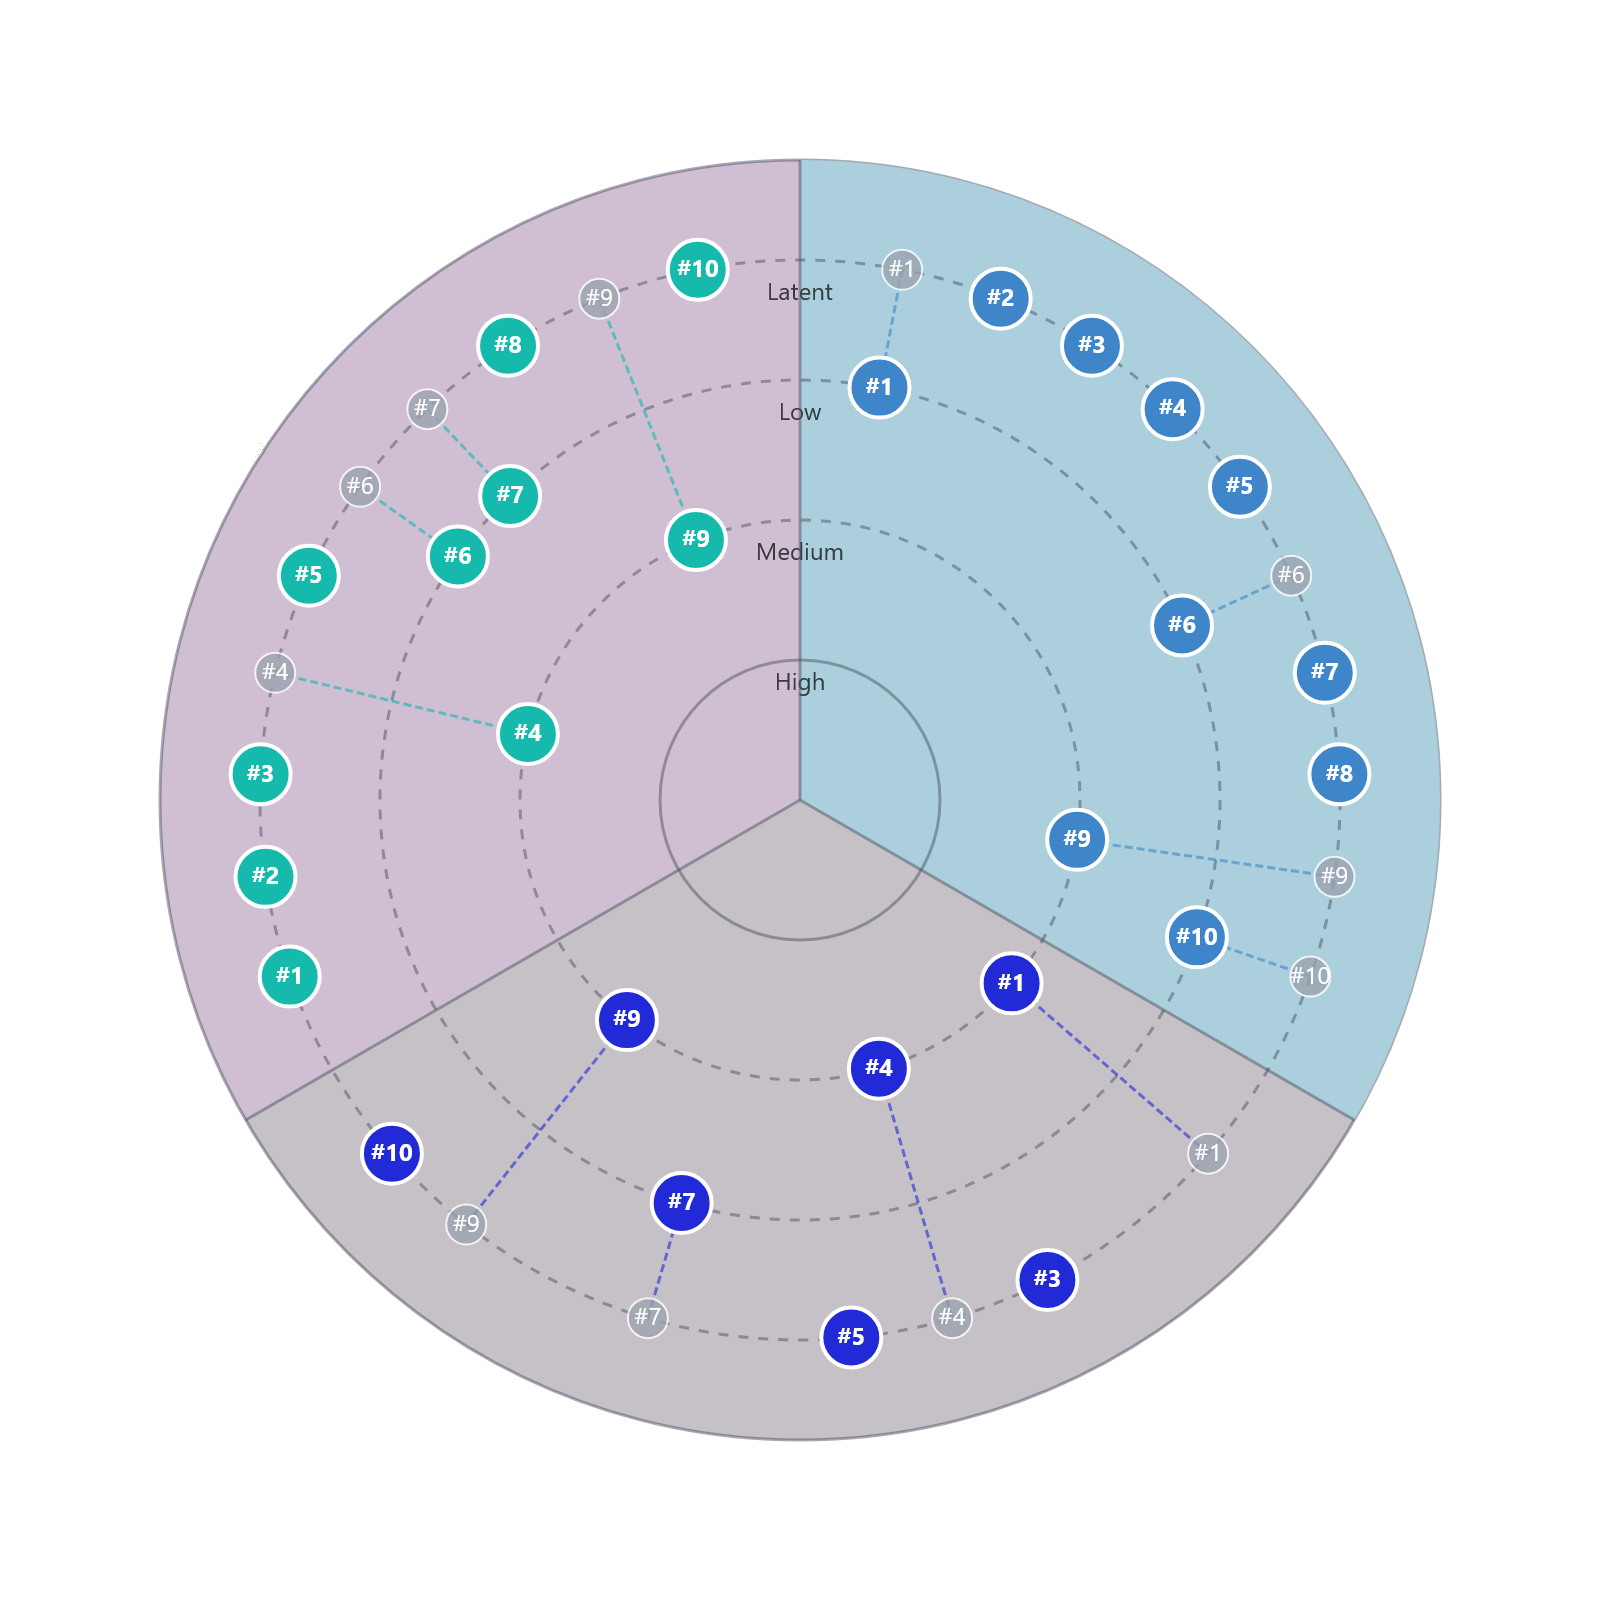
4. Threat Actor Capability Analysis
This view answers: "What is the preferred modus operandi of our adversaries?"
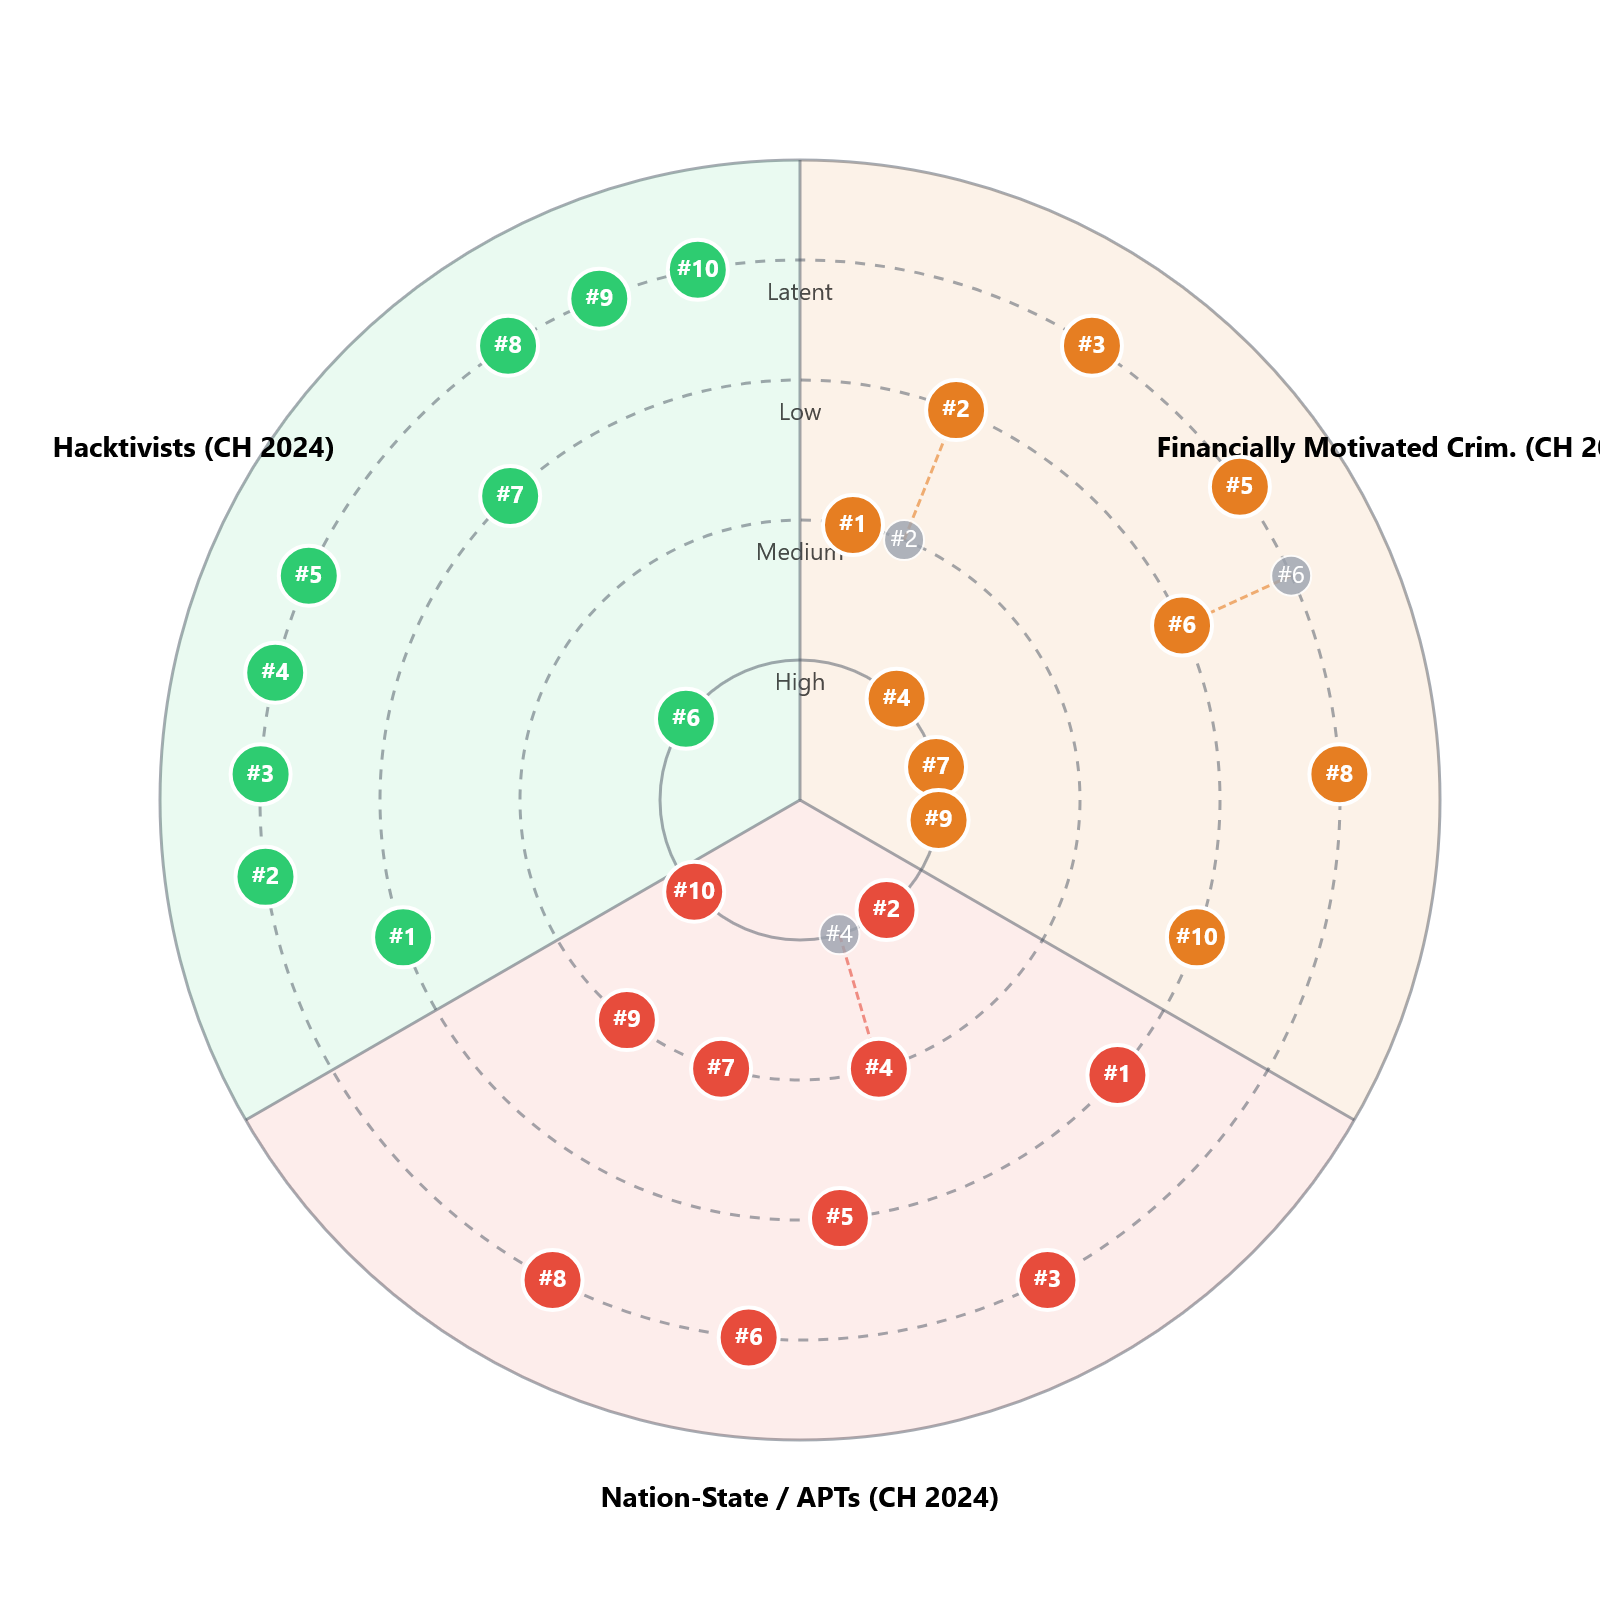
- Nation-State (APTs): Show broad capabilities across all clusters, with heavy reliance on #10 Supply Chain and #9 Social Engineering for stealthy initial access.
- Cyber Criminals: Heavily focused on monetization via #7 Malware (Ransomware) and #4 Identity Theft.
- Hacktivists: Often favor visible disruption via #6 Flooding and #1 Abuse of Functions (defacement).
5. Sector-Specific Threat Landscapes
This view answers: "How does the risk profile change based on my industry's business model?"
While the 10 TLCTC Clusters are universal, the intensity and frequency vary drastically by sector. A bank faces a different risk profile than a telecom provider or an IT service firm.
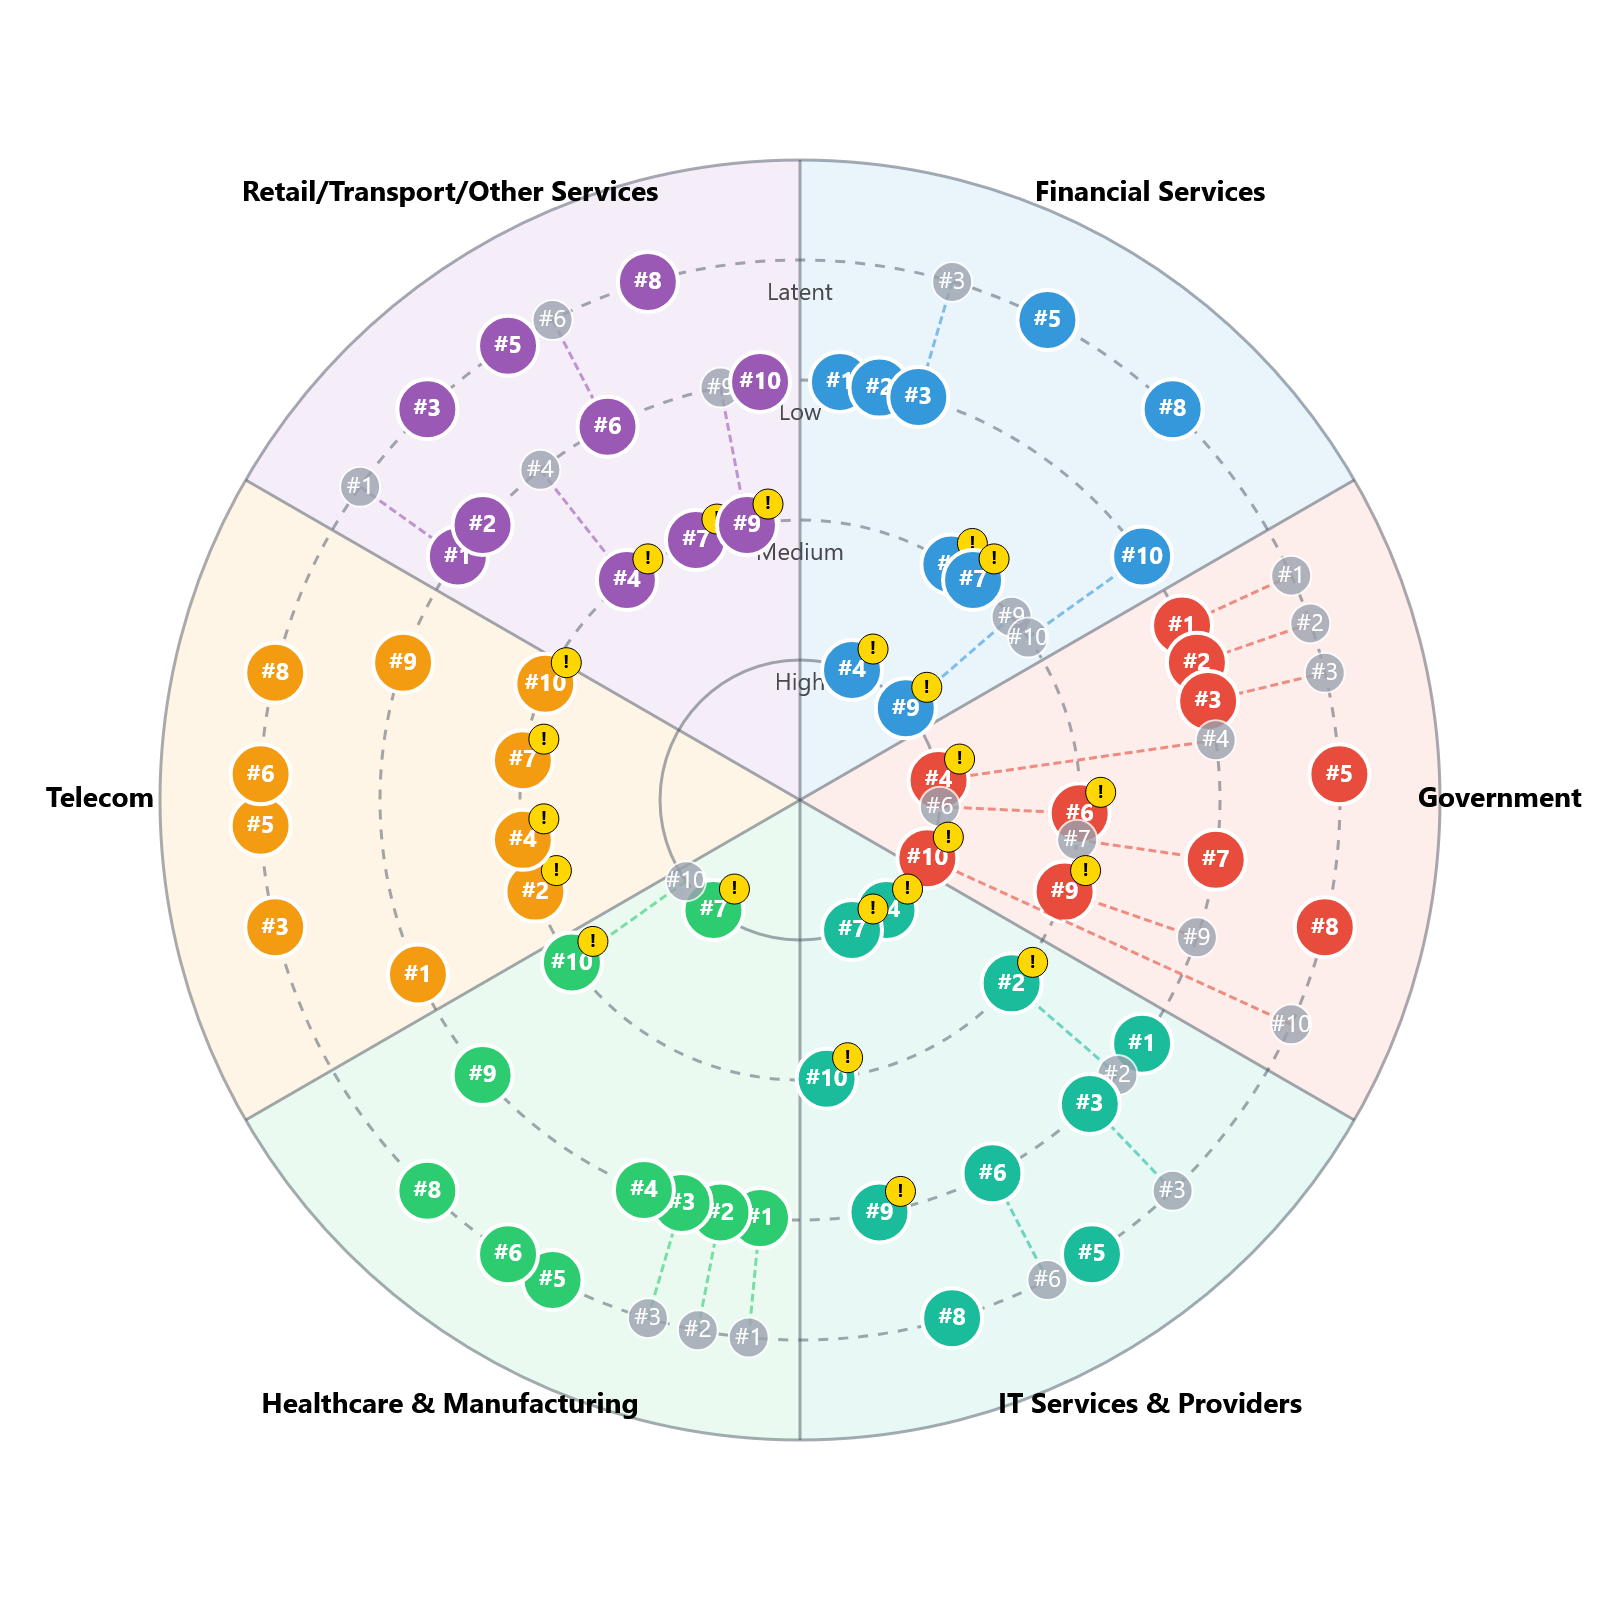
- Financial Services (Blue): High intensity in #4 Identity Theft and #9 Social Engineering. Attackers prioritize abusing human trust to steal credentials.
- IT Services & Providers (Green): The critical risk is #10 Supply Chain Attack. IT providers are the supply chain. Attackers compromise them to leverage the trusted relationship to deploy #7 Malware to downstream clients.
- Telecom (Orange): Unique exposure to #6 Flooding (DDoS against infrastructure) and #5 Man in the Middle (interception at the infrastructure level).
- Government (Red): A complex profile featuring high #10 Supply Chain and #9 Social Engineering.
Conclusion
The TLCTC Radar transforms the abstract 10 Clusters into a strategic tool. Whether you are analyzing your own organizational boundaries, profiling an APT group, or assessing sector-wide risks, the framework remains consistent.
By using the radar, security leaders can move from reactive "whack-a-mole" against individual exploits to a proactive defense strategy that addresses the fundamental Generic Vulnerabilities driving their specific risk landscape.
Note: This blog post utilizes the Top Level Cyber Threat Clusters (TLCTC) framework. Radar visualizations are open-source implementations of the framework's concepts.
Radar App Datasets: BACS 2024 Report
Use these JSON artifacts to visualize the BACS 2024 Cyber Landscape Report directly in the TLCTC Radar App. Each dataset corresponds to a specific analysis view.